
Operations Gateway
Introduction
OperationsGateway is a system designed to store and provide access to operational data for complex scientific or industrial facilities. It captures the data needed by staff to ensure systems are functioning as expected, including temperatures, pressures, settings, and other critical readings. This is distinct from experimental data used for downstream analysis. The platform allows these values to be recorded over time, then displayed and analysed. In addition to simple scalar values, it supports a range of more complex data types to meet diverse operational requirements.
The Problem
Operational data is frequently distributed across multiple systems, stored in inconsistent formats, and difficult to access or interpret. Tools like spreadsheets and raw log files often lack the structure and interactivity needed to provide a comprehensive view of system performance. This fragmentation makes it challenging to conduct diagnostics, monitor performance, or prepare for audits effectively.
The Solution
Operations Gateway offers a unified platform for accessing, visualising, and analysing operational data. It accommodates a wide range of data types, including scalar values, images, waveforms, and vectors. With powerful filtering, plotting, and inspection tools, along with session-based workflows and export options, it enables consistent analysis, clearer insights, and more efficient operational oversight.
The system supports several data types:
- Scalar values – A single number stored with units.
- Greyscale images – 8/16-bit images enhanced with false colour.
- Nullable images – Floating point images supporting NaN pixels and diverging colour maps.
- Waveforms – Pairs of x/y floating point arrays with units.
- Vector data – Arrays displayed as bar charts, with labels and units.
All data types are presented within the main data table, which includes thumbnail previews for complex values. Clicking a thumbnail opens a larger viewer for detailed inspection or export.
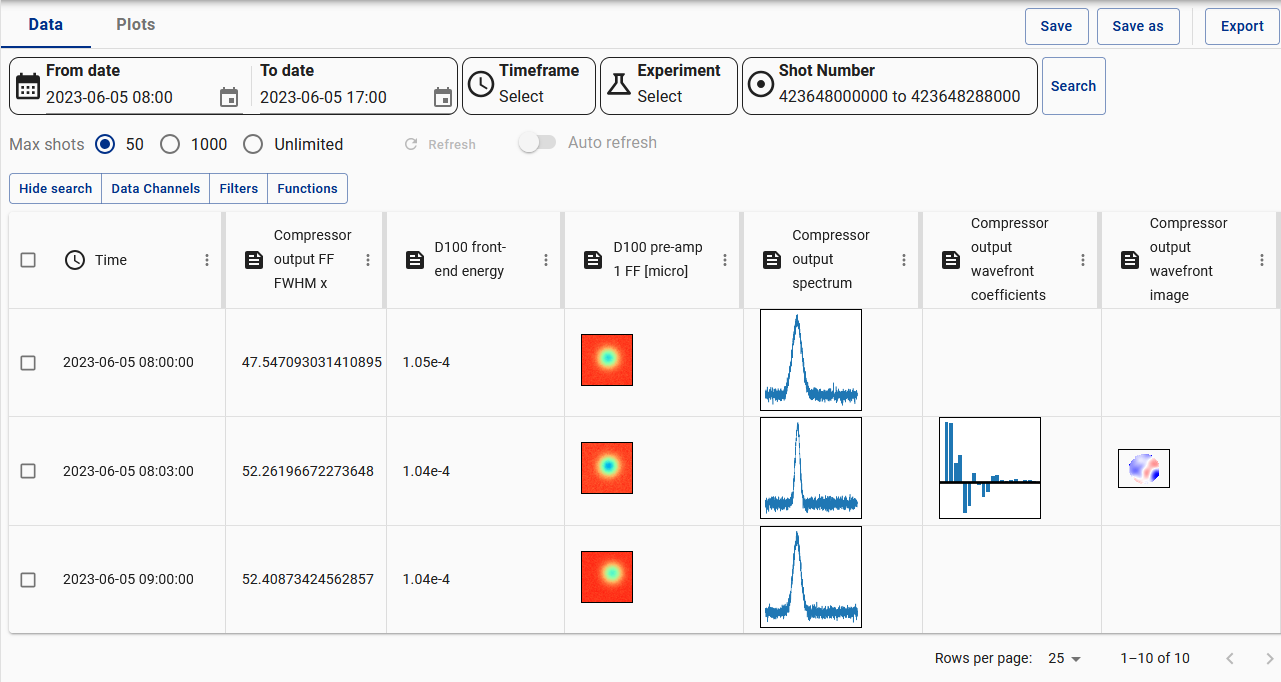
Users can apply filters to the table using a range of logical and comparison operators. These filters help narrow down relevant data and can be saved for future use.
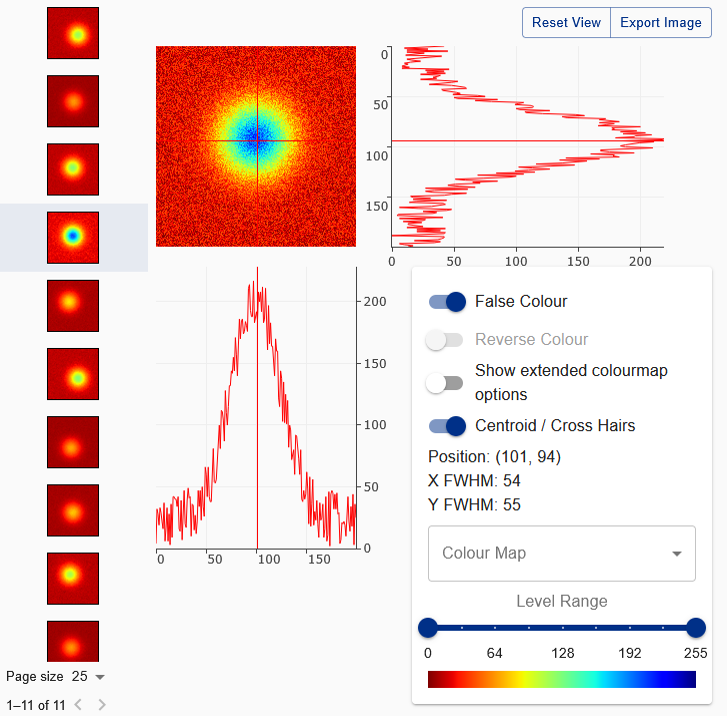
A dedicated viewer allows users to explore image data in detail. Images may be enhanced with false colour or diverging colour maps depending on the type.
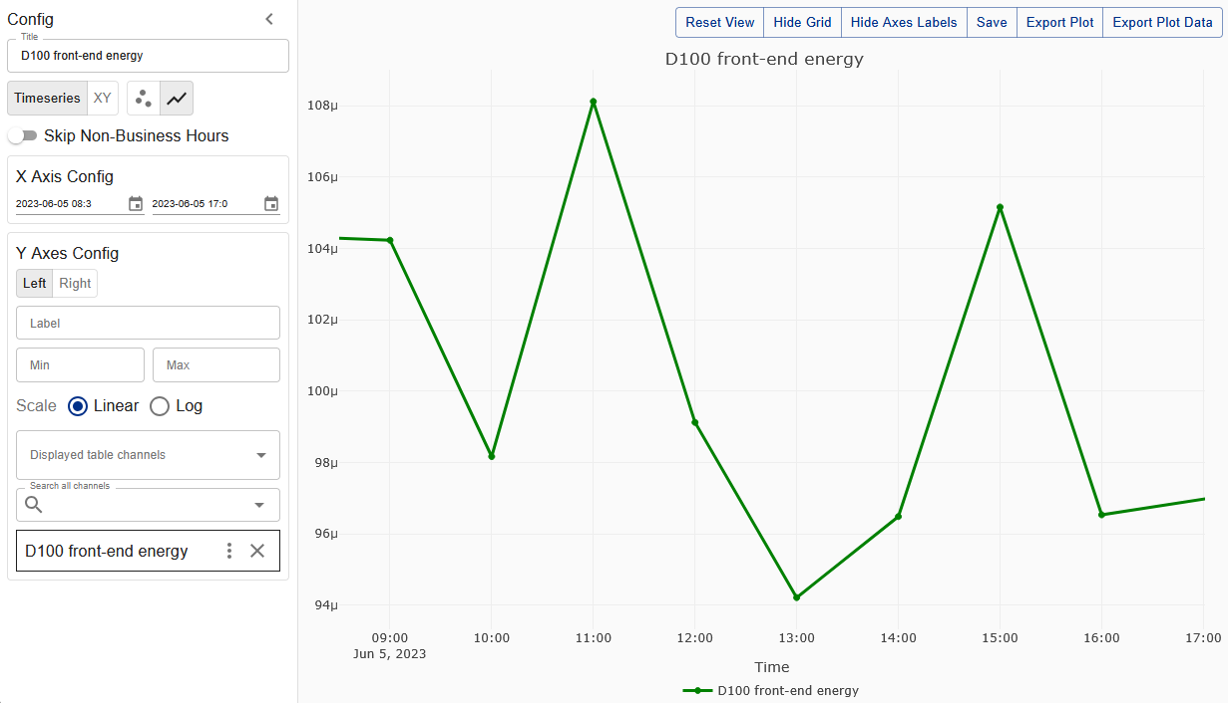
Scalar values from the table can be plotted against each other using the plotting window, enabling trend identification and correlation analysis.
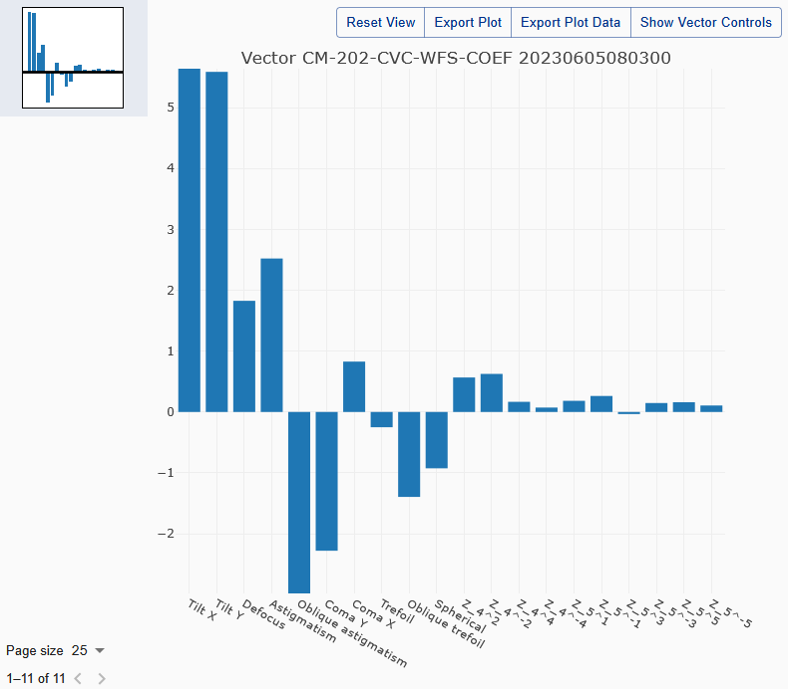
Vector data can be visualised as bar charts, supporting both positive and negative values with optional unit and label display.
Users can apply built-in functions to columns — such as mathematical operations or waveform transformations — to create virtual data channels that appear in the main table.
Sessions can be saved and reloaded later, allowing users to preserve filters, channel selections, and views for repeat analysis.
Any data visible in the main table or in viewer windows can be exported — either as rendered images or raw values — to support downstream analysis and reporting workflows.
The Software
Operations Gateway is built using a modular microservice architecture:
OperationsGateway API – Stores and serves operational data from various sources.
The frontend is composed of micro frontends for flexibility and scalability:
OperationsGateway UI – Provides the user interface for interacting with data tables, charts, and images.
SciGateway UI – Handles authentication and navigation across all modules.
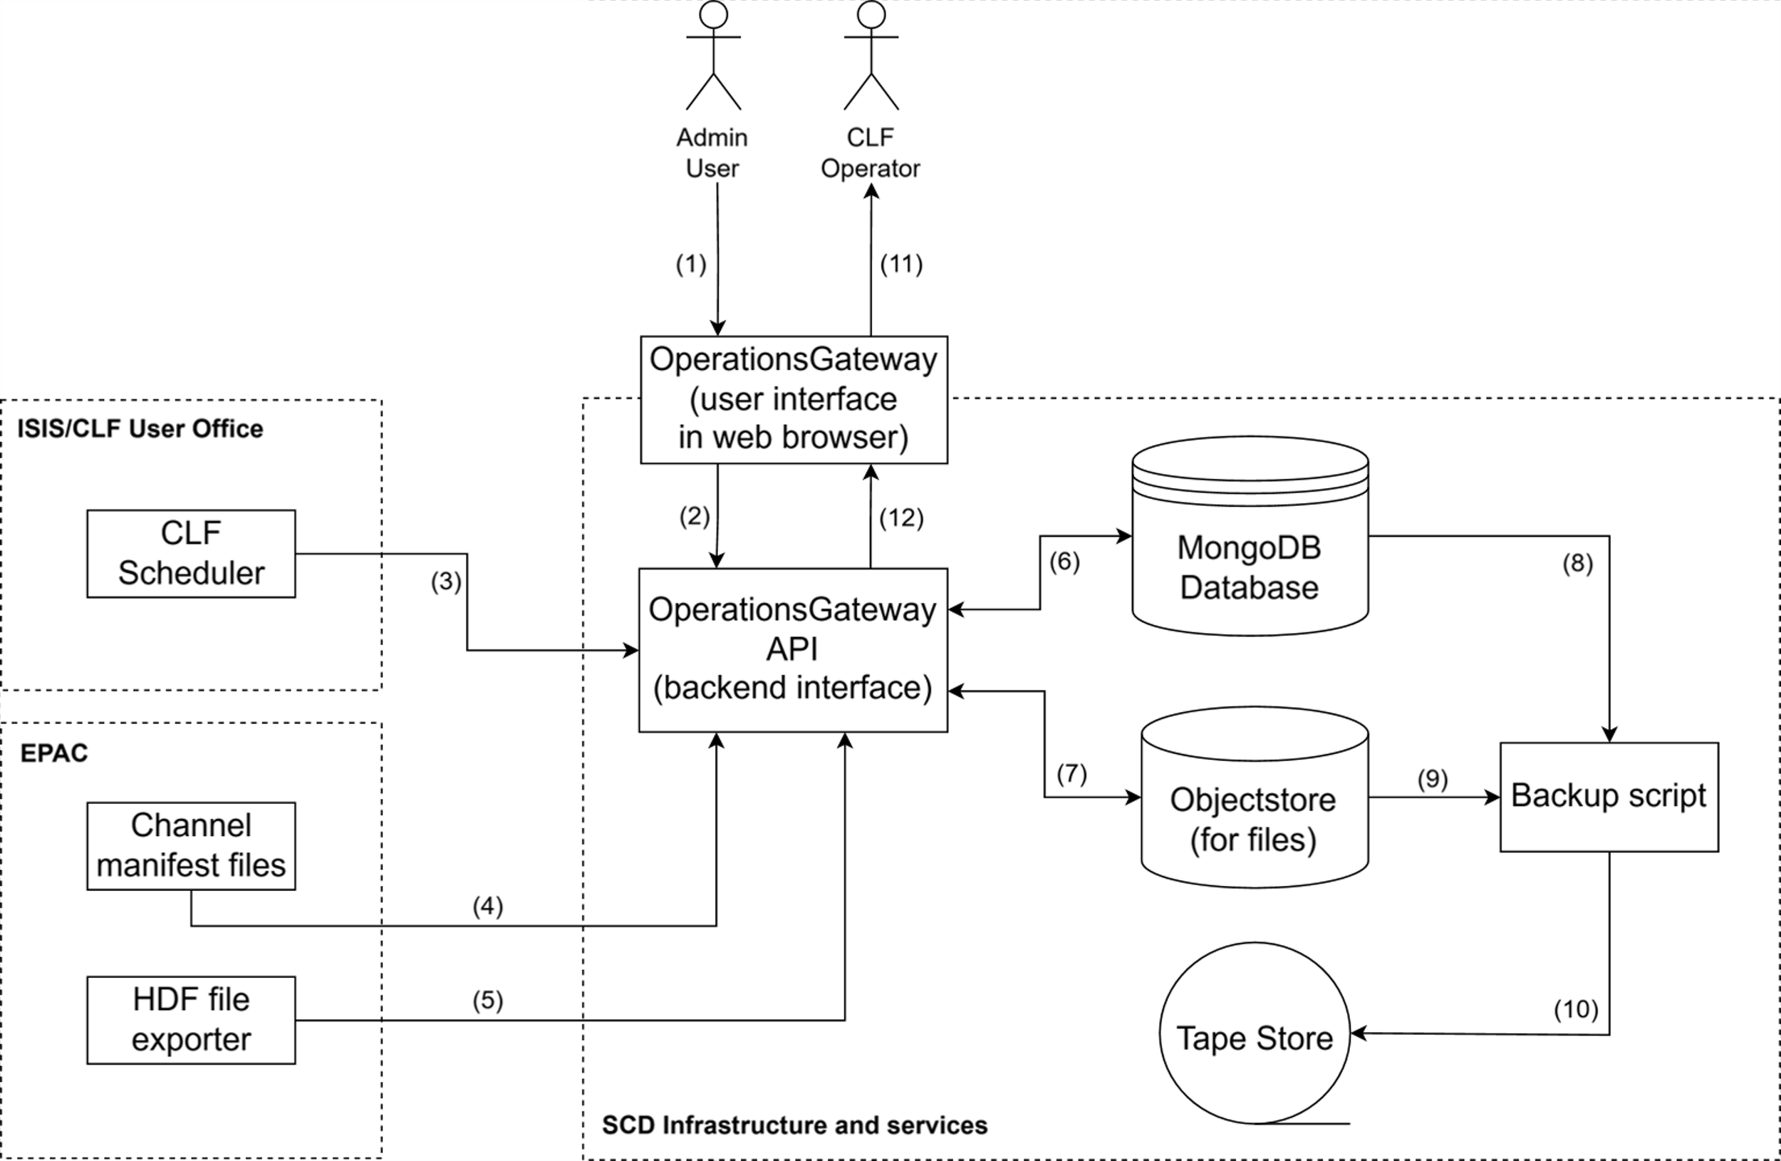 Operations Gateway System Architecture
Contact Us
Please reach out via GitHub or email the development team.